Infographics
Beyond Opioids: Rapid Increase in Drug Deaths Involving Stimulants copy
Published on: May 11, 2020. Updated on: July 22, 2022.
This infographic series highlights the rapid rise in overdose deaths involving cocaine and methamphetamine.
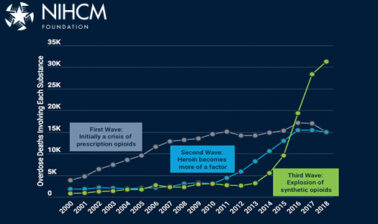
In recent years, much attention in the U.S. has been focused on the opioid crisis, which was responsible for nearly 46,000 overdose deaths in 2018. This crisis initially began to accelerate in the early 2000s with a steady rise in the abuse of prescription pain medications (wave 1), and beginning around 2010, opioid deaths increasingly involved heroin (wave 2). As of 2013, the ready availability of potent synthetic opioids such as fentanyl ushered in a new era of rapidly increasing opioid overdose deaths (wave 3), with the total number of opioid deaths doubling between 2013 and 2018. Deaths involving synthetic opioids have continued to rise very rapidly, even as involvement of commonly prescribed prescription opioids and heroin has leveled off recently.
While attention was riveted on these troubling trends, a second drug crisis related to stimulant abuse has been developing in the shadows. After almost a decade of remaining below its prior peak in 2006, deaths involving cocaine more than doubled between 2015 and 2018 (from 6,775 to 14,652). Deaths involving methamphetamine have been on a steady march upward since 2008, also more than doubling between 2015 and 2018 (from 5,697 to 12,649). By 2018, 25,838 Americans had died from an overdose involving cocaine, methamphetamine, or both substances together (a single death may involve multiple substances, including not only these stimulants but also opioids or other drugs).
To put these statistics in some context, the three most important causes of death reported by the CDC in 2018 were heart disease (more than 655,000 deaths), cancer (nearly 600,000 deaths) and unintentional injuries (167,000 deaths). Drug overdose deaths as a category are not among the top ten causes of death, but intentional overdose deaths are counted among the 48,000 deaths attributed to suicide, the tenth leading cause of death.
As the number of opioid overdose deaths soared from 17,268 to 45,865 over the 2008-2018 period, stimulants were increasingly involved in these deaths as well. By 2018, 35 percent (15,824) of opioid deaths also involved one or more stimulants (i.e., cocaine, methamphetamine or both substances), up from 15 percent (2,542) of the opioid deaths in 2008.
Throughout the period, cocaine was consistently more likely than methamphetamine to be involved in opioid overdoses (any cocaine use is counted here, whether it was the only stimulant involved or whether methamphetamine was also involved).
However, the share of opioid deaths involving methamphetamine rose much more quickly over the decade. In 2008, only 2.5 percent of all opioid deaths (436 / 17,268) had co-involvement of methamphetamine. A decade later, this share had grown to 13.6 percent (6,260 / 45,865), for a ten-year increase of more than 440 percent.
The increasing co-involvement of stimulants and opioids in overdose deaths can also be seen by examining the share of stimulant overdoses that also involve various types of opioids.
Over the 2008-2018 period, as the number of stimulant overdose deaths more than quadrupled from 6,307 to 25,838, the share of these deaths that involved one or more opioids rose from 40 percent to 61 percent.
Moreover, the three waves of the opioid crisis can be clearly seen within these stimulant deaths. In 2008, commonly prescribed opioid medications were the opioid type most likely to be involved in stimulant overdoses, being present in 27 percent of stimulant deaths. Five years later, the rising prominence of heroin can be detected, with this substance slightly eclipsing prescription opioids as the type of opioid most often involved in stimulant deaths. By 2018, the importance of both of those opioid types has been dwarfed by the explosion of synthetic opioids. Forty-five percent of all stimulant overdose deaths in 2018 also involved a synthetic opioid.
While methamphetamine use, on its own, is not as immediately lethal as other types of drug use, the rising stimulant death rates and the growing involvement of synthetic opioids is leading to speculation that fentanyl is increasingly being mixed into cocaine and methamphetamine accidentally by dealers who are handling both fentanyl and stimulants.
Additionally, some users may intentionally alternate between opioids (which are depressants) and stimulants in an attempt to balance out the highs and lows of these different substances. For example, Ellis, Kasper and Cicero (2018) report that among people seeking treatment for a primary indication of opioid use disorder, past-month use of methamphetamine rose from 18.8% in 2011 to 34.2% in 2017.
Stimulant overdose deaths are affecting different parts of the U.S. differently. In 2018, age-adjusted death rates involving cocaine were higher in Florida, all along the Atlantic coast into New England and westward into the East North Central census division. Florida is a well-known portal for cocaine coming into the U.S. from the Caribbean and South America, and the East coast is a well-travelled trafficking corridor.
In contrast, methamphetamine death rates are higher in the Western U.S., corresponding to the supplies coming from Mexico, and spreading into the center of the country.
The burden of opioid deaths is also spread unevenly across the U.S., particularly for deaths involving heroin and synthetic opioids. Heroin death rates are higher in the eastern portion of the U.S., as are deaths involving synthetic opioids. This phenomenon has been attributed to the fact that powdered heroin is typically used in this area of the country, and is more easily mixed with synthetic opioids, making for a potent and deadly combination. In contrast, the heroin used in the western portion of the country is a tar-like substance that does not mix easily with synthetic opioids, providing a small measure of protection against unintended heroin overdoses. For prescription opioids, while there are some state hot spots with elevated death rates, strong geographic patterns are harder to detect.
Utilization patterns for stimulants also vary geographically. Among people age 12 or older in 2018, prevalence of recent cocaine use was highest in the West and Northeast, with more than 2 percent of this population reporting cocaine use in the past year. Past-year and past-month use of methamphetamine was also highest in the West, followed by the Midwest, and lowest in the Northeast.
Distinct utilization patterns also exist by degree of urbanization. Use of cocaine in the past year or in the past month was consistently higher in more urbanized areas. The opposite pattern was observed for methamphetamine use, with prevalence of use for this substance lower in urbanized areas and higher in non-metro areas.
The health care delivery system has felt the impact of the rising rates of use of methamphetamine, with dramatic increases in the number of inpatient admissions and emergency department visits associated with methamphetamine.
On the inpatient side, after a temporary downturn in the mid-2000s, the number of methamphetamine-related admissions has increased dramatically, rising well over three-fold from 57,331 admissions in 2008 to 206,265 in 2016.
The increase was even more dramatic for emergency department visits. Over this same period, the total number of ED visits related to methamphetamine rose from 107,544 to 445,416, a more than four-fold jump. Of these visits, the number of cases that were treated in the ED and then discharged to the community or another care setting rose more quickly than did cases that were admitted to the associated hospital after preliminary evaluation and treatment in the ED.
Between 2007 and 2017, the number of admissions to substance abuse treatment programs declined by more than 150,000. Classified by the primary substance use responsible for the admission, the largest declines were seen for alcohol, marijuana and cocaine treatment. In contrast, the number of treatment admissions for heroin use rose very dramatically, while there were more modest increases in admissions for other opiates and synthetics and for methamphetamine and amphetamine stimulants.
Trends in Death Rates
Data on drug overdose deaths were derived from the multiple cause of death files of the Wide-ranging Online Data for Epidemiologic Research (WONDER) data system maintained by the Centers for Disease Control and Prevention (CDC).
Deaths were identified as due to an overdose if the ICD-10 code for the underlying cause of death was X40-X44 (accidental poisoning), X60-X64 (intentional self-poisoning) or Y10-14 (poisoning of undetermined intent). A small number of overdose deaths that were the result of homicide (underlying cause of death X85) were excluded from the analyses.
Within this group of overdose deaths, the substances involved in the overdose were identified using the multiple cause of death codes: T40.1 (heroin), T40.2 (natural and semi-synthetic opioids), T40.3 (methadone), T40.4 (synthetic opioids other than methadone), T40.5 (cocaine) and T43.6 (psychostimulants with abuse potential, e.g., methamphetamine). Following the classification scheme adopted by the CDC, natural and semi-synthetic opioids (e.g., oxycodone and hydrocodone) and methadone were grouped into a single category encompassing commonly prescribed opioids. Synthetic opioids other than methadone include substances such as tramadol and fentanyl (both pharmaceutically manufactured and illicitly manufactured).
Because a single death may involve multiple substances, it is not possible to sum across the number of deaths involving specific substances to derive the total number of overdose deaths.
Co-Involvement of Opioids and Stimulants
Information on co-involvement of opioids and stimulants was also derived from the multiple cause of death files of the WONDER data system. The analysis for graph 2 above began with the universe of overdose deaths involving one or more opioid substances, and then identified instances where specific types of stimulants were also involved. For graph 3, the starting point was the universe of overdose deaths involving one or both types of stimulants, and then instances in which specific types of opioids were also involved were identified.
State Variation in Drug Overdose Death Rates
State-by-state variation in overdose death rates involving specific types of stimulants and opioids reflect 2018 data from the WONDER system. To enhance comparability across states, death rates were computed using age-adjusted population estimates.
Prevalence of Stimulant Use
The prevalence of cocaine and methamphetamine use by Census region and degree of urbanization is from Tables 1.68B, 1.69B, 1.74B and 1.75B from the 2018 report of the National Survey of Drug Use and Health, reflecting past-year and past-month use of the substances by persons aged 12 or older.
Health System Impacts of Amphetamines
Data on inpatient admissions and emergency department visits were derived from the Healthcare Cost and Utilization Project files available from the HCUPnet query tool maintained by the Agency for Healthcare Research and Quality.
Following work by Winkelman et al. (2018), the following ICD-9-CM codes were used to identify amphetamine-related care prior to 2015. The corresponding ICD-10-CM codes were used for 2016, reflecting the coding system update implemented in 2015.
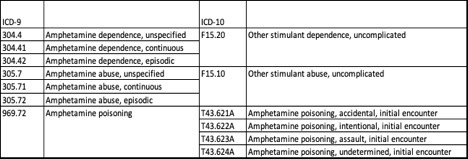
All available diagnosis codes from the record for the visit or admission were used (not just the principal diagnosis). While the ICD coding system does not permit identification of methamphetamine use distinct from illicit use of amphetamines and nonmedical use of prescription amphetamines, the large majority of care identified by these codes is believed to be due to methamphetamine use.
Emergency department visits include cases that were subsequently admitted to the associated inpatient hospital for further care and those discharged to the community or other care setting (the so-called “treat and release” cases). Inpatient admissions include patients admitted through the associated emergency department and those admitted from the community or other settings.
Treatment System Admissions
Data on treatment system admissions are from Table 1.1a of the 2017 report on the Treatment Episode Data Set (TEDS), compiled and maintained by the Substance Abuse and Mental Health Services Administration. TEDS data reflect admissions to substance use treatment systems that receive public funds and/or are licensed or certified by a state substance abuse agency. A given patient may have multiple admissions. Specific data shown in this graph capture admissions for people aged 12 and older, classified by the primary substance use associated with the admission.
Related Resources
Infographics
Published on: May 12, 2020. Updated on: May 18, 2021.
The Evolution of the Opioid Crisis: 2000-2018
More Related Content
See More on: Prescription Drugs | Social Determinants of Health | Substance Use