Data Visualization
NIHCM’s infographics are concise, visually compelling resources that provide insights and strategies for addressing current health issues.
Infographics
Published on: January 16, 2024. Updated on: February 15, 2024.
Gun Violence: The Impact on Society
This infographic explores the rapidly increasing health and economic costs of gun violence across the United States.
Read Article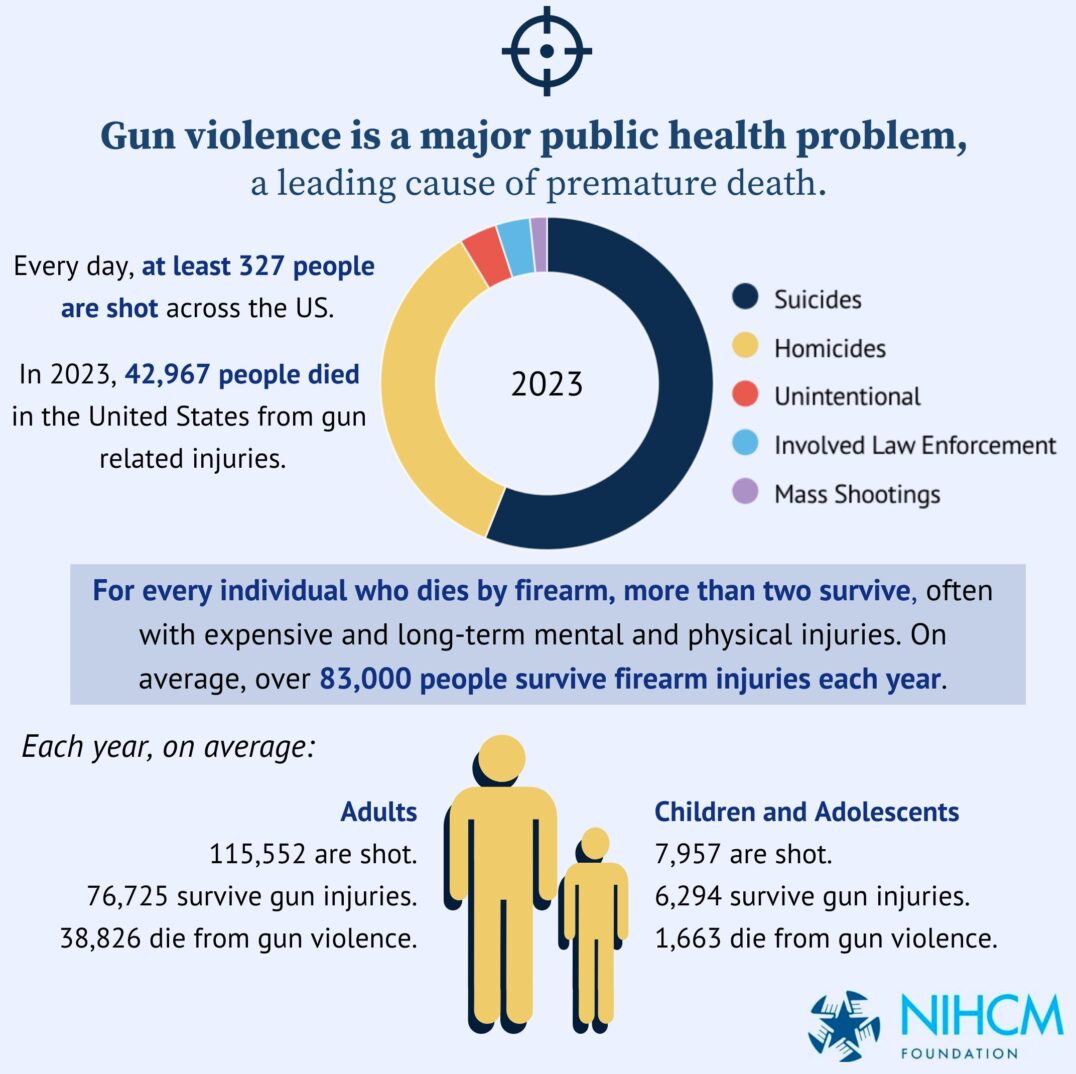
By the Numbers
More than 70%
of US women will experience uterine fibroids by 50 years old.
80% of rural America
is medically underserved.
74% of cocaine deaths
involved a synthetic opioid