Infographics
The Stealth Drug Crisis: Rising Burden of Stimulant Use
Published on: May 12, 2020. Updated on: August 20, 2021.
About the Data Insights
This infographic delves into an emerging public health emergency involving rapidly rising rates of stimulant use and related overdose deaths, which has been occurring in the shadow of the opioid crisis. The two crises are closely linked, with many overdose deaths involving both stimulants and opioids, particularly synthetic opioids such as fentanyl. Methamphetamine use tends to be higher in non-urbanized areas and presents a heavy burden on law enforcement agencies and hospitals in addition to the very high personal toll on users. While much work is underway to develop new medical treatments for methamphetamine dependence, the current treatment arsenal relies on behavioral therapies.
Notes on Data and Methods
Use Prevalence Estimates
Changes in the prevalence of past-year use of cocaine and methamphetamine were derived from data in the 2015 and 2018 reports of the National Survey of Drug Use and Health (NSDUH) and reflect use by persons age 12 or older. Beginning in 2015, the NSDUH introduced new questions about methamphetamine use (i.e., abuse) distinct from the use of prescription stimulants. It is not possible to examine trends in methamphetamine abuse prior to 2015.
For added precision, rather than relying on reported prevalence rates rounded to just one decimal point (e.g., as in Tables 1.38B and 1.58B from the 2015 report and 1.29B and 1.41B in the 2018 report), more precise prevalence rates were computed based on the numbers of people using each substance (Tables 1.38A and 1.58A from the 2015 report and 1.29A and 1.41A from the 2018 report) and the U.S. population (Table12.1A from both the 2015 and 2018 reports). These rates were used to compute the percent change in prevalence between 2015 and 2018. This approach yielded the following calculations:
Past-Year Cocaine Use
2015 prevalence rate = 4.828M users / 267.694M population = 1.80355%
2018 prevalence rate = 5.529 / 273.753 = 2.0197%
Change in prevalence rates = 11.985%
Past-Year Methamphetamine Use
2015 prevalence rate = 1.713 / 267.694 = 0.63991%
2018 prevalence rate = 1.867 / 273.753 = 0.682%
Change in prevalence rates = 6.578%
Note that if the reported prevalence rates rounded to one decimal place had been used (0.6 for 2015 and 0.7 for 2018), the change in methamphetamine prevalence would have appeared to have been 16.7%. Rounding error did not make as large of a difference for cocaine prevalence rates.
Trends in Death Rates
Data on stimulant overdose deaths were derived from the multiple cause of death files of the Wide-ranging Online Data for Epidemiologic Research (WONDER) data system maintained by the Centers for Disease Control and Prevention (CDC).
Deaths were identified as due to an overdose if the ICD-10 code for the underlying cause of death was X40-X44 (accidental poisoning), X60-X64 (intentional self-poisoning) or Y10-14 (poisoning of undetermined intent). A small number of overdose deaths that were the result of homicide (underlying cause of death X85) were excluded from the analyses.
Within this group of overdose deaths, the substances involved in the overdose were identified using the multiple cause of death codes: T40.5 (cocaine) and T43.6 (psychostimulants with abuse potential, e.g., methamphetamine).
Because a single death may involve multiple substances, it is not possible to sum across the number of deaths involving specific stimulants to derive the total number of stimulant overdose deaths.
Information on co-involvement of opioids in stimulant deaths was also derived from the multiple cause of death files of the Wide-ranging Online Data for Epidemiologic Research (WONDER) data system maintained by the Centers for Disease Control and Prevention (CDC).
Beginning with the universe of overdose deaths involving, respectively, cocaine or methamphetamine (defined as in Panel 1), the multiple cause of death codes were used to identify instances where specific types of opioids were also involved. Following the classification scheme adopted by the CDC, methadone (T40.3) and natural and semi-synthetic opioids (T40.2) were grouped into a single category for commonly prescribed opioids. Heroin involvement was identified using the multiple cause of death code T40.1, and synthetic opioid involvement was identified using code T40.4 (synthetic opioids other than methadone), which includes substances such as tramadol and fentanyl (both pharmaceutically manufactured and illicitly manufactured).
Because a single death may involve multiple substances, none of these categories are mutually exclusive. For example, the universe of cocaine deaths includes deaths involving only cocaine as well as deaths involving cocaine and other substances. Likewise, cocaine deaths involving heroin, for example, might also involve a synthetic opioid.
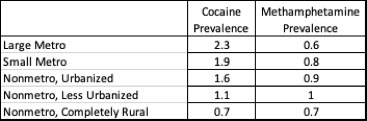
Prevalence of Stimulant Use by Urbanization
The prevalence of cocaine and methamphetamine use by degree of urbanization is from Tables 1.68B and 1.74B from the 2018 report of the National Survey of Drug Use and Health, reflecting past-year use of the substances by persons aged 12 or older.
State Variation in Stimulant Death Rates
State-by-state variation in cocaine and methamphetamine death rates were derived from the CDC’s WONDER data system and reflect 2018 data. To enhance comparability across states, death rates were computed using age-adjusted population estimates.
Law Enforcement Views on Methamphetamine
Data on drug threats faced by law enforcement agencies are from the 2017 National Drug Threat Survey (NDTS) as reported in the 2017 National Drug Threat Assessment report. Conducted annually by the U.S. Drug Enforcement Agency, the 2017 NDTS data reflect responses from more than 5,000 local law enforcement agencies from across the nation.
Health System Impacts of Amphetamines
Data on emergency department visits and inpatient admissions were derived from the Healthcare Cost and Utilization Project files available from the HCUPnet query tool maintained by the Agency for Healthcare Research and Quality.
Following work by Winkelman et al. (2018), the following ICD-9-CM codes were used to identify amphetamine-related care in 2006. The corresponding ICD-10-CM codes were used for 2016, reflecting the coding system update implemented in 2015.
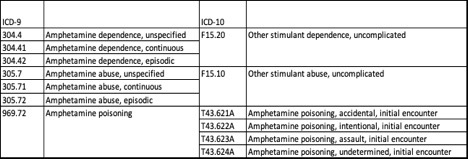
All available diagnosis codes from the record for the visit or admission were used (not just the principal diagnosis). While the ICD coding system does not permit identification of methamphetamine use distinct from illicit use of amphetamines and nonmedical use of prescription amphetamines, the large majority of care identified by these codes is believed to be due to methamphetamine use.
Emergency department visits include cases that were subsequently admitted to the associated inpatient hospital for further care and those discharged to the community or other care setting (the so-called “treat and release” cases). Inpatient admissions include patients admitted through the associated emergency department and those admitted from the community or other settings.
Long-Term Health Risks of Methamphetamine
The long-term health risks of methamphetamine use are widely reported including in a recent fact sheet from the National Institute on Drug Abuse and a comprehensive NIDA Research Report.
Information on treatment options for methamphetamine abuse and the possibility of reversing some of the drug’s neurobiological effects is from a NIDA Research Report, last updated in October 2019.
Data on treatment system admissions are from Table 14.5b of the 2017 report on the Treatment Episode Data Set (TEDS), compiled and maintained by the Substance Abuse and Mental Health Services Administration. TEDS data reflect admissions to substance use treatment systems that receive public funds and/or are licensed or certified by a state substance abuse agency. A given patient may have multiple admissions. Specific data shown in this graph reflect the percent change between 2007 and 2017 in per capita treatment system admissions rates for people aged 12 and older for whom methamphetamine or amphetamine was the primary substance associated with the admission.
Related Resources

Webinar
May 18, 2020. Updated on: March 02, 2021.
Growing Challenges of Substance Use, Treatment & Recovery During COVID-19
More Related Content
See More on: Prescription Drugs | Social Determinants of Health | Substance Use